To the Teacher:
A new book by French economist Thomas Piketty has become a surprise bestseller in America this year. Capital in the Twenty-First Century argues that, with a few exceptions, economic inequality has increased steadily in the United States and Europe over the past two centuries.
The unexpected popularity of Piketty's book has provided a new occasion to discuss economic inequality in America: Why has the gap between the wealthy and everyone else grown so dramatically? What impact does this gulf have? Is inequality necessarily a bad thing, and, if so, why?
This lesson consists of two student readings and one classroom exercise focusing on the issue of economic inequality in the United States. The first reading looks at how much inequality has grown in recent decades. The second reading considers Piketty's solution of progressive taxation as a means of combating inequality, weighing arguments both in favor of and against the proposal. Questions for student discussion follow each reading.
Following the two readings is a classroom exercise in quantitative literacy. It asks students to think critically about how statistical information about inequality is presented visually in charts, graphs, and other infographics.
Student Reading 1:
Inequality: The Growing Gap Between the Rich and Everyone Else
A new book by French economist Thomas Piketty has become a surprise bestseller in America this year. Capital in the Twenty-First Century argues that, with a few exceptions (including during World War 2), economic inequality has increased steadily in the United States and Europe over the past two centuries.
The unexpected popularity of Piketty's book has provided a new occasion to discuss economic inequality in America: Why has the gap between the wealthy and everyone else grown so dramatically? What impact does this gulf have? Is inequality necessarily a bad thing, and, if so, why?
Neil Irwin, a blogger for the New York Times, summed up Piketty's main argument in a May 30, 2014 post:
In Capital in the Twenty-First Century, published in the United States in March (and in France last year) Mr. Piketty combined that data work with some literary criticism, philosophy, theory and prognostication for a sweeping look at the past, present and his expected future of inequality of wealth and income. It has been on the New York Times best-seller list for six weeks, including three in the No. 1 spot. This is not common for a book about economics, and this one happens to be 696 pages.
Piketty's analysis reinforces warnings that other observers have already made about growing inequality in the United States. The growing wealth gap was a main target of the Occupy movement that erupted across the country in late 2011. Recently, members of the United States Congress have cited inequality as a reason for why the minimum wage need to be raised.
In 2011, Dave Gilson and Carolyn Perot of MotherJones.com compiled a startling set of statistics documenting the current economic landscape in the United States. Their work showed that the richest 1 percent of Americans control 34.6 percent of the wealth in the country. Meanwhile, the richest 10 percent control more than 73 percent of the nation's wealth. (For a fun and interactive way to demonstrate wealth inequality in the classroom, see this classic activity developed by United for a Fair Economy.)
In a February 19, 2014, report for the Economic Policy Institute, economists Estelle Sommeiller and Mark Price detailed the extent to which the wealthiest Americans have been reaping the vast majority of the economic gains for the past several decades:
- Between 1979 and 2007, the top 1 percent took home well over half (53.9 percent) of the total increase in U.S. income. Over this period, the average income of the bottom 99 percent of U.S. taxpayers grew by 18.9 percent. Simultaneously, the average income of the top 1 percent grew over 10 times as much—by 200.5 percent.
- Lopsided income growth characterizes every state between 1979 and 2007.
- In four states (Nevada, Wyoming, Michigan, and Alaska), only the top 1 percent experienced rising incomes between 1979 and 2007, and the average income of the bottom 99 percent fell.
- In another 15 states the top 1 percent captured between half and 84 percent of all income growth between 1979 and 2007....
- After incomes at all levels declined as a result of the Great Recession, lopsided income growth has reemerged since the recovery began in 2009, with the top 1 percent capturing an alarming share of economic growth.
- University of California at Berkeley economist Emmanuel Saez estimates that between 2009 and 2012, the top 1 percent captured 95 percent of total income growth.
Is this trend toward growing inequality necessarily a bad thing? Not everyone believes that it is. As Holly Ellyatt reported for CNBC.com on January 8, 2013:
"Although many people consider income inequality a social ill, it is important to understand that income inequality has many economic benefits and is the result of - and not a detriment to - a well-functioning economy," Garrett wrote...
Income inequality, he adds, is "a by-product of a functioning capitalist society" and the wealthiest had more, because they were more productive, Garrett affirmed.
He is not alone. Edward Conard, a former partner at asset management firm Bain Capital argued that inequality was actually good for economic growth. In his book, "Unintended Consequences: Everything You've Been Told about the Economy is Wrong," Conard said that concentrating wealth in a skilled investor class helps fuel U.S. innovation, a tenet of the "American Dream."
But many others see inequality as a scourge. Religious figures such as Pope Francis argue that it is morally wrong for vast amounts of wealth to be concentrated in the hands of the few while millions of others struggle to pay for the basic necessities of life. On April 28, 2014 the Pope tweeted, "Inequality is the root of social evil."
David Callahan, senior fellow at the liberal think tank Demos, argues that dramatic inequality is also bad for the economy. In a November 18, 2013 post for the American Prospect, Callahan writes:
It all makes sense. And it makes sense whether the economy truly stinks like it does now, or is simply underperforming, which was the case through much of the Bush years.
What's more, this critique of inequality doesn't just appeal to those who are hurting or care about fairness. It appeals to anyone who wants more customers for their goods and services. Or anyone who wants America to compete well against China and Germany in coming decades.
Many policymakers and ordinary citizens are calling for government action to address the widening wealth gap.
For Discussion:
1. Do students have any questions about the reading? How might they be answered?
2. Are you surprised by the statistics about inequality presented in the reading? Why or why not?
3. Some people do not think inequality is necessarily a bad thing. What are some of their arguments?
4. How do critics of inequality respond? Why do they think we should be worried about this issue?
5. What do you think? Should growing inequality be a matter of public concern? Is it consistent or inconsistent with the type of country you would like to live in?
Student Reading 2:
Addressing Inequality: Is Progressive Taxation the Answer?
Economists, advocates, and policymakers have proposed a variety of ways to address the issue of inequality. One common proposal—which is defended by Thomas Piketty in his book, Capital in the Twenty-First Century—is that tax rates should become more progressive. This means that those with the most money should pay a larger share of their earnings in taxes to benefit the public good. This proposal has prompted a debate about whether such taxes would help to promote "equality of opportunity" in the United States.
In a February 16, 2014 op-ed, for the Washington Post, Larry Summers, a Harvard economist and former U.S. Treasury Secretary, argued that fighting inequality will require closing loopholes through which the wealthy avoid paying taxes:
Meanwhile, the ratio of corporate tax collections to the market value of U.S. corporations is near a record low, thanks to various loopholes. And the estate tax can be substantially avoided by those prepared to plan and seek sophisticated advice. Closing loopholes that only the wealthy can enjoy would enable targeted tax measures such as the earned-income tax credit to raise the incomes of the poor and middle class more than dollar for dollar by incentivizing working and saving.
It is ironic that those who profess the most enthusiasm for market forces are least enthusiastic about curbing tax benefits for the wealthy. Sooner or later, inequality will be addressed. Much better that it be done by letting market forces operate and then working to improve the result than by seeking to thwart their operation.
Many conservatives balk at the idea of tax increases, however. One reason for this, they argue, is that progressive taxes subvert the important American principle of "equality of opportunity." This concept holds that what is important is not that Americans possess roughly equal levels of wealth. Instead, people should have a fair chance to succeed or fail based on their efforts. Republican Congressman and former Vice Presidential candidate Paul Ryan expressed this position in an October 2011 speech. Ryan argued:
If you believe in the former, you follow the American Idea that justice is done when we level the playing field at the starting line, and rewards are proportionate to merit and effort.
If you believe in the latter kind of equality, you think most differences in wealth and rewards are matters of luck or exploitation, and that few really deserve what they have.
That's the moral basis of class warfare - a false morality that confuses fairness with redistribution, and promotes class envy instead of social mobility.
But is equality of opportunity a reality in our country, given our level of inequality? In a March 9, 2014, article in the New York Times, economist Paul Krugman writes that raising taxes on the wealthy can be seen as a way of improving educational opportunities for all and creating a more level playing field between the children of the wealthy and those from families with fewer resources. Krugman writes:
In fact, low-income children are much less likely to complete college than their affluent counterparts, with the gap widening rapidly. And this isn't just bad for those unlucky enough to be born to the wrong parents; it represents a huge and growing waste of human potential — a waste that surely acts as a powerful if invisible drag on economic growth.
Now, I don't want to claim that addressing income inequality would help everyone. The very affluent would lose more from higher taxes than they gained from better economic growth. But it's pretty clear that taking on inequality would be good, not just for the poor, but for the middle class...
In short, what's good for the 1 percent isn't good for America. And we don't have to keep living in a new Gilded Age if we don't want to.
For Discussion:
1. Do students have any questions about the reading? How might they be answered?
2. What are progressive taxes? What is the argument for why some people should pay a larger percentage of their income in taxes than other people? Do you agree or disagree with these arguments?
3. Other taxes, such as a tax on gasoline, are considered "regressive." What characterizes a regressive tax? What might be the downside to regressive taxes?
4. Representative Paul Ryan distinguishes "equality of opportunity" from "equality of outcome." What is the difference between these two concepts?
5. Do you think equality of opportunity is a reality in America today? Why or why not?
6. What steps might be taken to ensure greater equality of opportunity? Do you think more progressive taxation would have a positive or negative impact in achieving this goal? Defend your position.
Classroom Exercise:
Quantitative Literacy—Thinking Critically About How Inequality is Represented
Like many other economic issues, discussion of inequality in America often involves a variety of charts and graphs. These provide visual illustration of some of the relevant data on the issue. However, there can be a lot of variation in the way in which data is presented. The following exercise is designed to have students think critically about the graphic presentation of data around inequality. It is divided into three parts.
Part I:
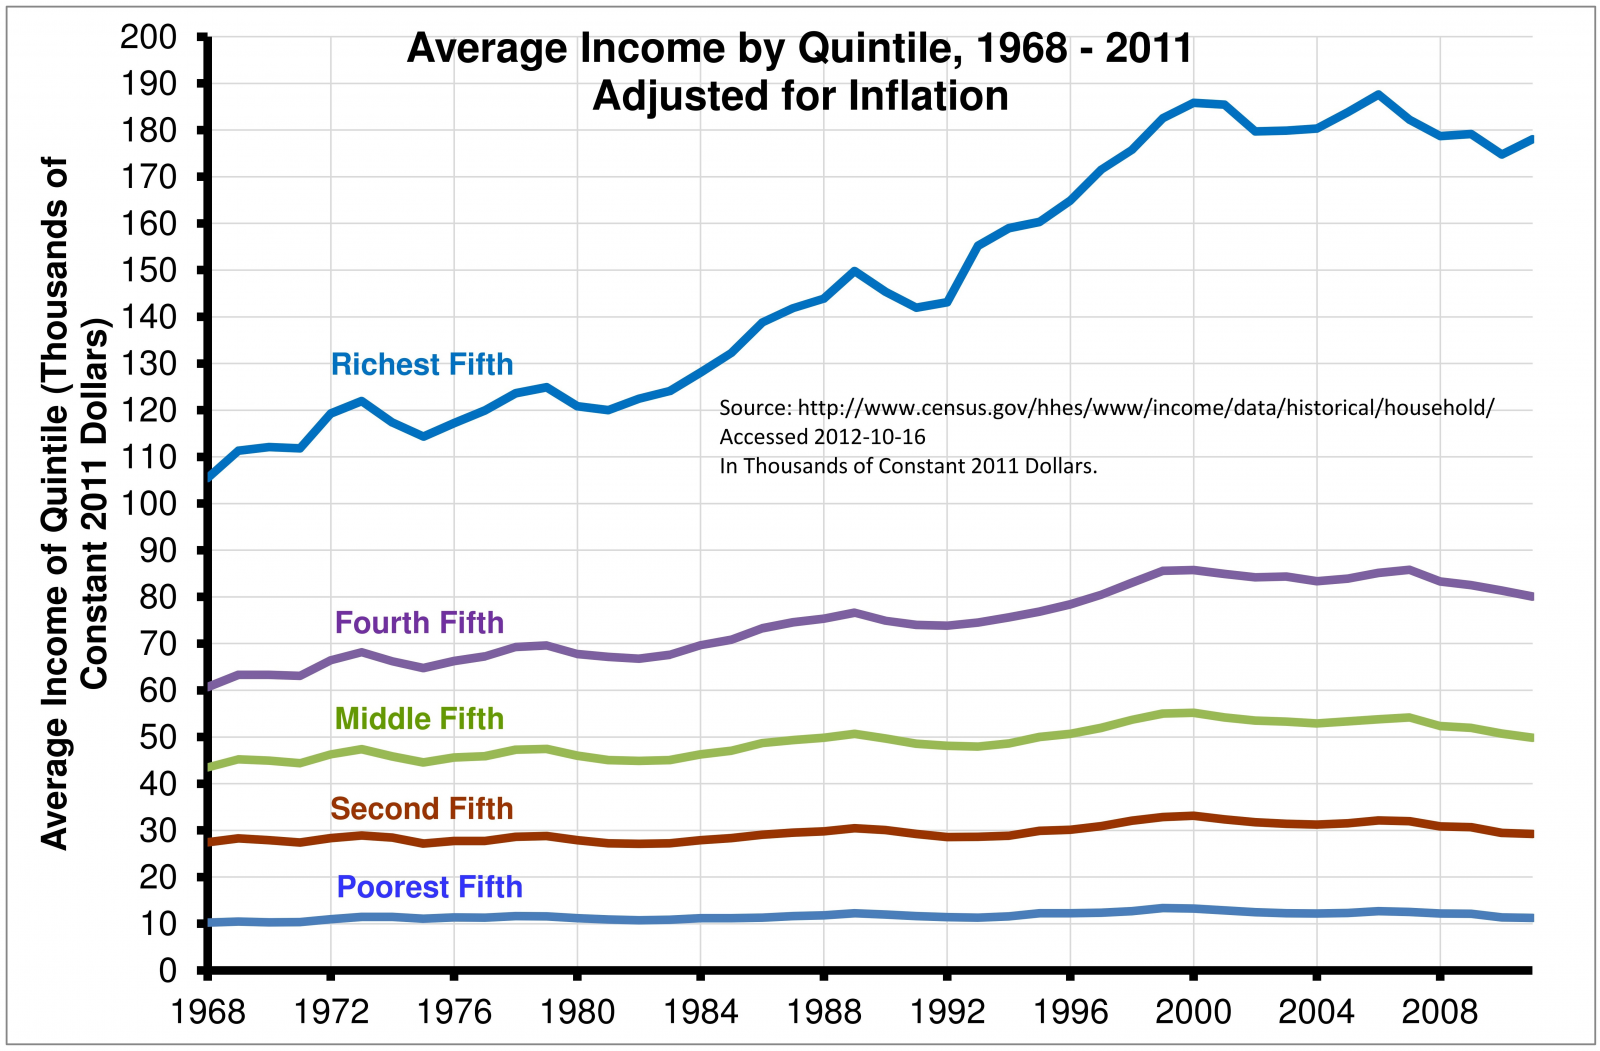
Graphing Household Income
The two graphs on the following page chart income distribution in America. Although the two graphs are similar, they have important differences. Have students examine the two graphs and discuss the questions below.
GRAPH 1:

GRAPH 2:
Questions for Discussion:
1. How does the graph on the top differ from the graph on the bottom?
2. In what ways does the inclusion of the top 1 percent in the Mother Jones graph (Graph 1) affect the presentation of the remaining data? What are some of the positive and negative consequences of tracking the top 1 percent as its own line on the graph?
3. Considering how the second graph represents the data, do you think the first graph could be misleading? Why or why not?
4. Some people might argue that we don't need to be concerned about inequality because "a rising tide lifts all boats." How do these graphs affect your view of that argument?
Part II:
Different Approaches to Visualizing Data
In April 2012, Mother Jones magazine posted on its website a series of infographics that present data on inequality in different ways.
Have students examine the graphics on the Mother Jones site, then reflect as a class or in small groups on the following questions:
1. What are some of the different methodologies that this magazine uses to present data about inequality?
2. Which graphic most stood out for you? Why do you think that this one was particularly effective?
3. Were there any graphics that you found confusing? How might this have been more clear?
4. Were there any graphics that you thought were misleading in the way that they presented data? Why?
5. People often talk about income distribution as which group has the largest "piece of the pie." However, this set of graphics does not use any pie charts. Could you make a pie chart based on the data presented? What would be the advantages or disadvantages of presenting the data in this way?
Part III:
Many videos attempt to make static charts and graphs more dynamic. This video on inequality represents one such effort.
Watch the video, then, as a class or in small groups, reflect on the following questions:
1. How is the data presented in the video similar to the graphs above and to the other infographics you have considered? How is it different?
2. Did you find the video to be a more interesting presentation of the data or was the animation unnecessary? Explain your position.
3. Can you think of any other examples of where statistical information has appeared in video format? What impression did these examples make on you?